
Publicus Institute, commissioned by Népszava, conducted a nationwide representative opinion poll between the 30th of March and 4th of April, asking 1007 people about their opinions on different nationalities: whether they find them likeable or unlikable.
(Ezen kutatás magyar nyelven itt olvasható.)
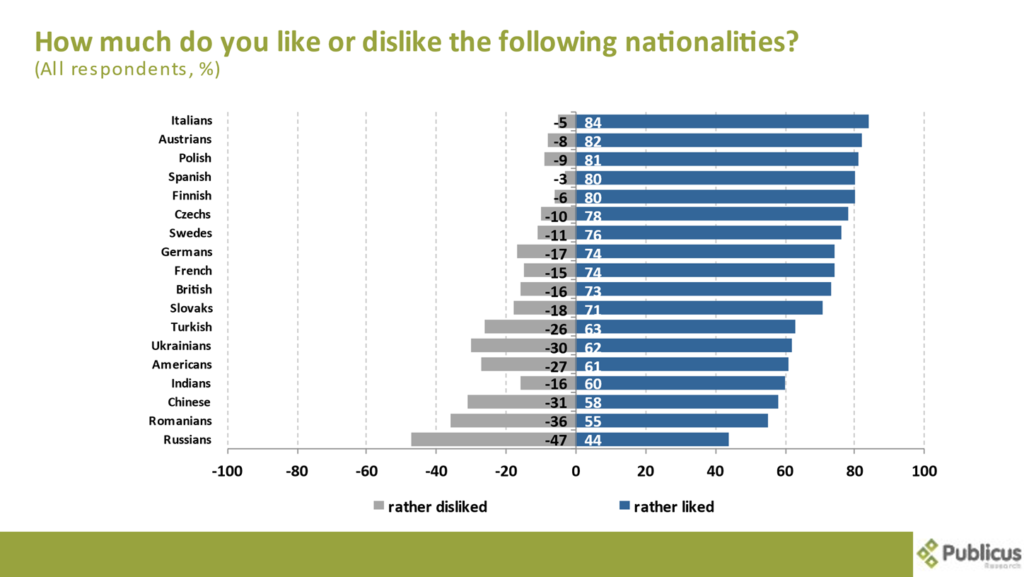
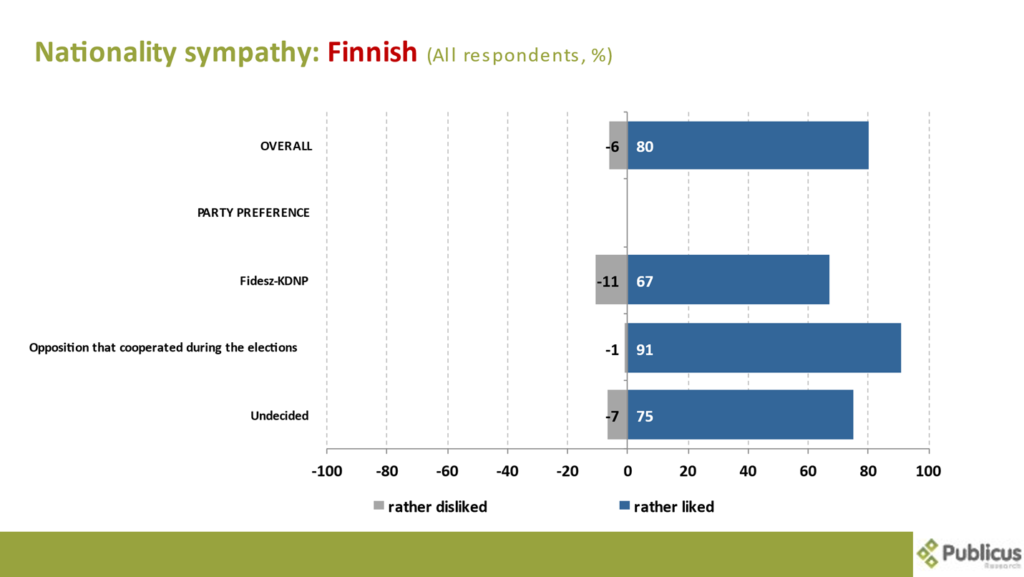
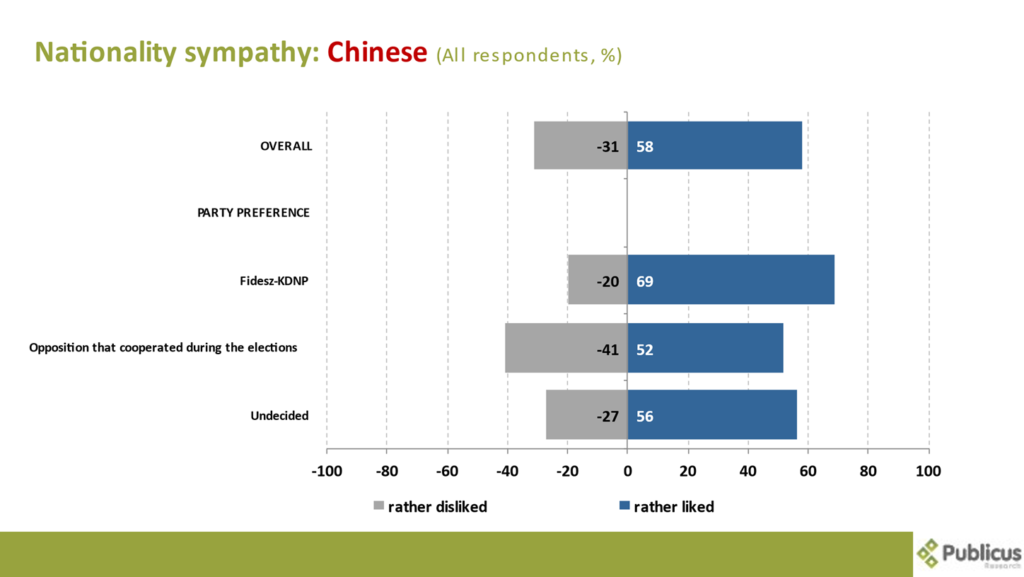
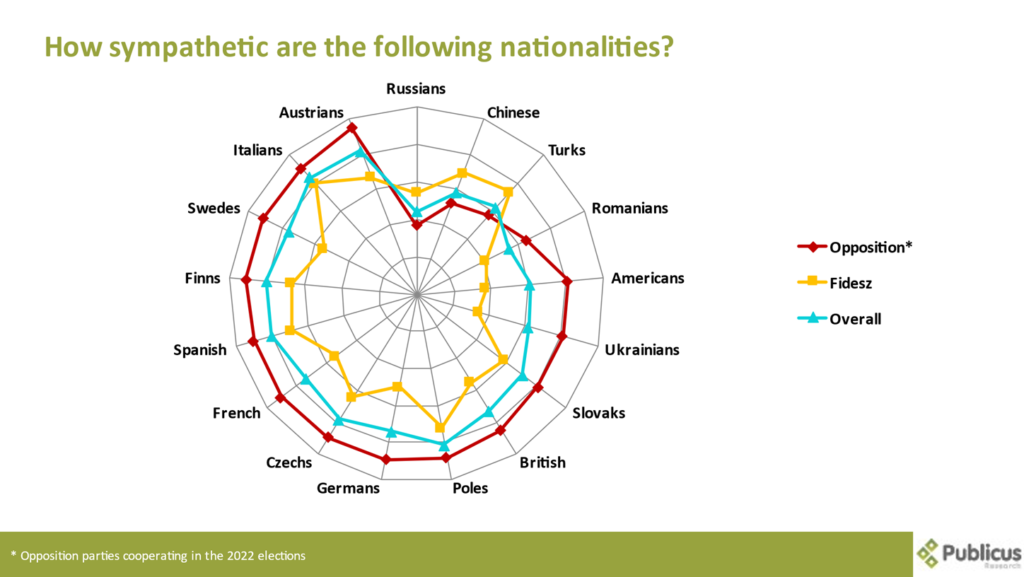
Respondents consider Finnish, Spanish, Polish, Austrian and Italian people to be the most likeable (between 80 and 84 per cent), while the Ukrainians (30 percent), Chinese (31 percent), Romanians (36 percent) and Russians (47 percent) are the most disliked.
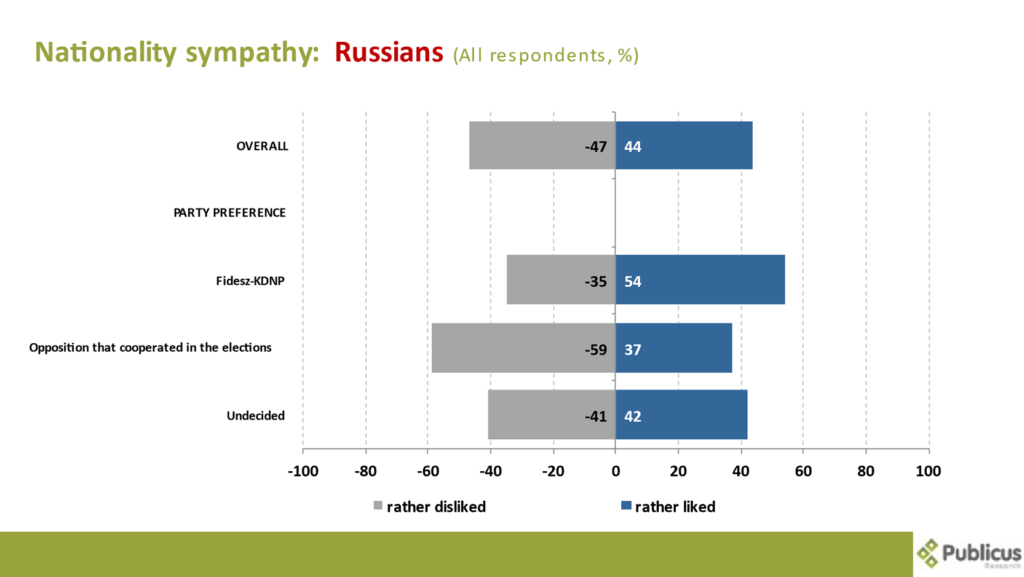
The least liked nation was Russia (44 percent), but there is a clear party-political fault line, with Fidesz voters finding them significantly more likeable than voters of the opposition parties that cooperated in the election (54 percent and 37 percent respectively).
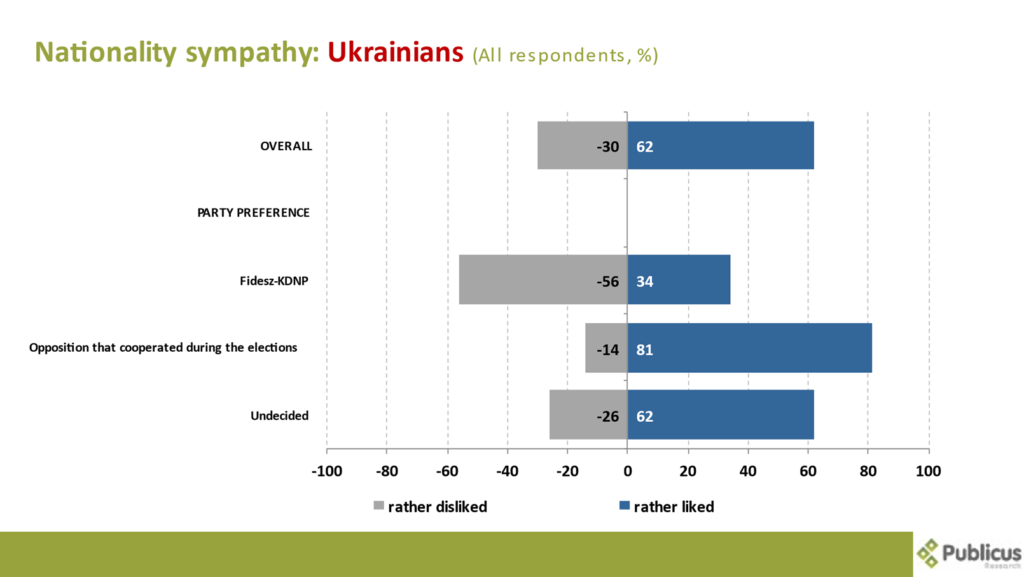
It is also worth examining the Ukrainian figures after the Russian ones: while 81 percent of voters of the opposition parties that cooperated in the elections rather consider the Ukrainians to be sympathetic, the figure for Fidesz voters is 34 percent. Among governing party voters, there are far more of those who rather find Ukrainians unlikable (56 percent).
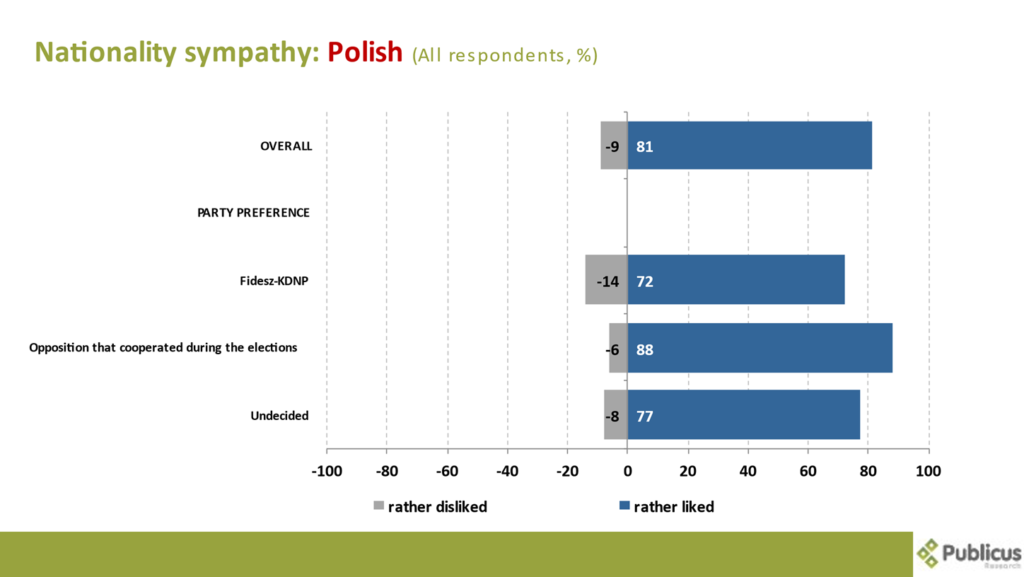
In the context of the “traditional Polish-Hungarian friendship”, it is worth noting the slight party-political fault line: Fidesz voters were less sympathetic towards Poles than voters of the opposition parties that cooperated in the elections (72 and 88 percent respectively). Presumably, this is another result of the government’s pro-Russian policies.
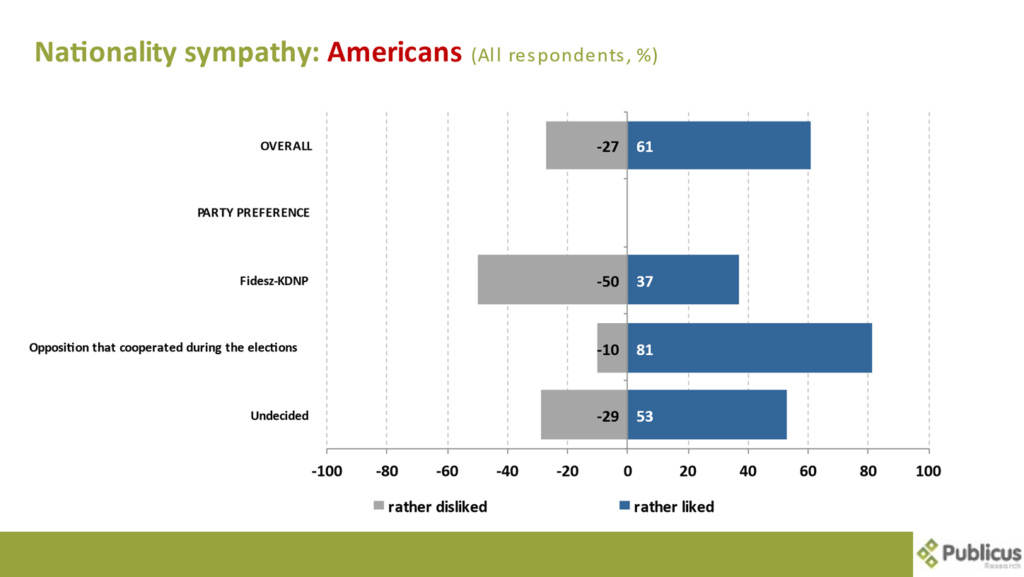
Americans are seen as sympathetic by 81 percent of voters of the opposition parties that cooperated in the elections, compared to 37 percent of Fidesz voters. Thus, voters of the governing party consider the Russians much more sympathetic than the Americans (54 and 37 percent respectively).
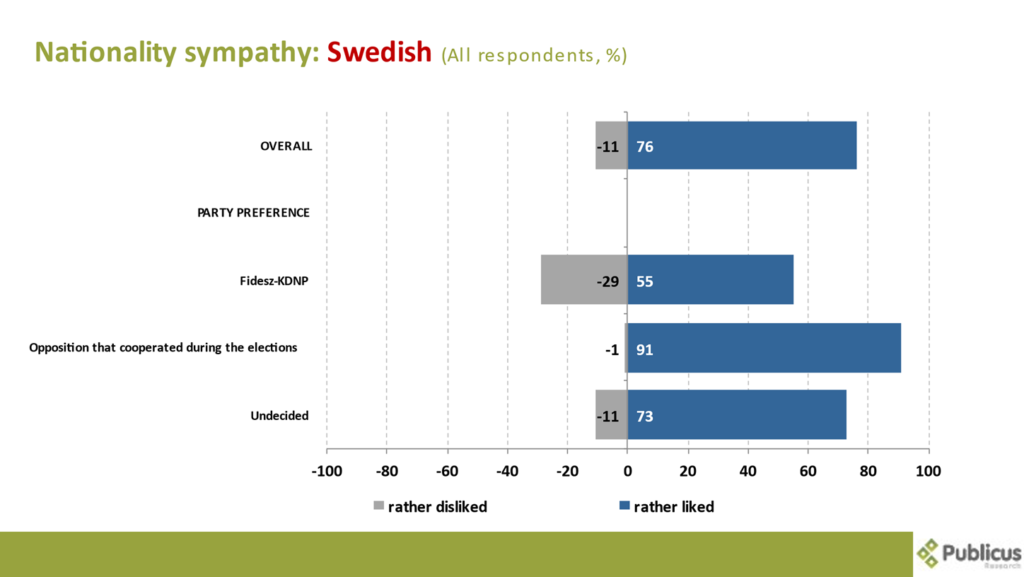
In the context of Swedish and Finnish accession to NATO, it is worth looking at the data for the two Nordic countries: 67 percent of Fidesz voters consider the Finns to be sympathetic, which is far below the overall figure for opposition voters (91 percent).
The Swedes are only considered likeable by 55 percent of Fidesz voters, meaning that the government’s message of not loving them or allowing them into NATO may be working effectively.
Apart from the Russians, there are two other nations that Fidesz voters consider more sympathetic than voters of the opposition parties that cooperated in the elections do: the Chinese and the Turkish. The Chinese are seen as sympathetic by 69 percent of Fidesz voters, compared to only 52 percent of opposition voters.
74 percent of Fidesz voters consider Turks sympathetic; this figure is 57-57 percent among voters of opposition parties that cooperated in the election, and undecided voters.

These results show that Fidesz’s messages have been getting through to its voter base: people living in states that are hardly democratic (Russians, Chinese and Turks – as shown in the graph below) are considered much more sympathetic by voters of Fidesz, than voters of opposition parties that cooperated in the elections, or the overall average. Moreover, of the nations listed, pro-government voters like the Ukrainians the least (34 percent), followed at second place not by the Russians (54 percent), but rather by, for example, the Americans (37 percent) or the Germans (50 percent), nations that are supposedly our allies.
More details on the results of the survey can be found in the print and online editions of Népszava. Please also refer to Népszava when presenting the survey.
Methodology
The survey was conducted by Publicus Institute as a part of Publicus Omnibusz, between the 30th of March and the 4th of April 2023, polling 1007 individuals via phone, who are representative of the adult population of Hungary. The potential distortions of sampling were corrected with weighting based on the data from the 2016 KSH census data. The attributes of the surveyed accurately resemble those of the Hungarian population by their sex, age, educational attainment, regional and settlement wise composition. With this sample size, we can state with a 95 percent confidence level that the data obtained through testing would only differ by +/-3,1 percent at most from that we would have gotten when surveying all 18 year old or older residents. The statistical error is larger however, when the distribution is configured not to all surveyed, but to certain smaller subgroups.


